Note
Click here to download the full example code
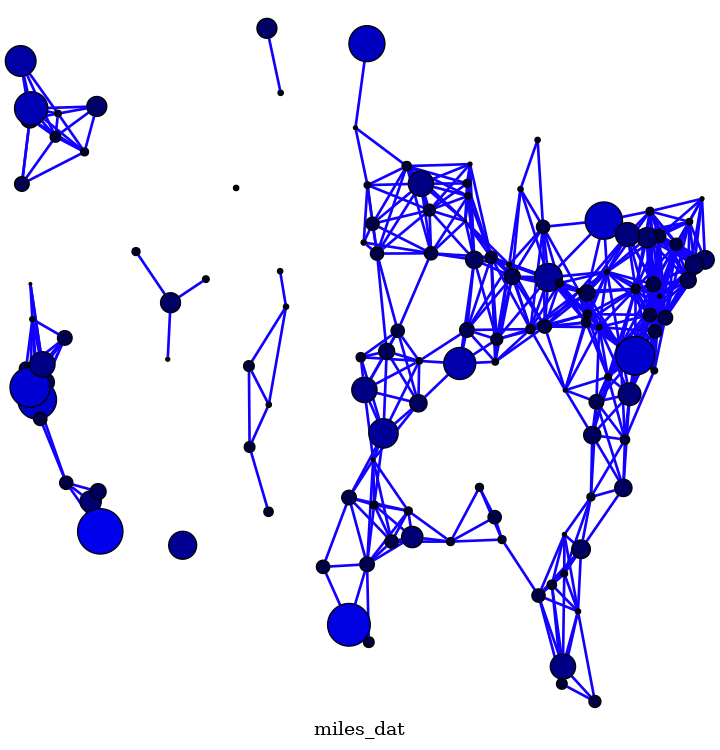
Knuth Miles
An example that shows how to add your own positions to nodes and have graphviz “neato” position the edges.
miles_graph() returns an undirected graph over the 128 US cities from the datafile miles_dat.txt.
This example is described in Section 1.1 in Knuth’s book 1 2.
The data used in this example is copied from 2. The filename and header have been modified to adhere to the request of the author to not corrupt the original source file content and name.
References.
- 1
Donald E. Knuth, “The Stanford GraphBase: A Platform for Combinatorial Computing”, ACM Press, New York, 1993.
- 2(1,2)
Out:
Loaded miles_dat.txt containing 128 cities.
Wrote miles.dot
Wrote miles.png
__author__ = """Aric Hagberg (aric.hagberg@gmail.com)"""


def miles_graph():
    """Return a graph from the data in miles_dat.txt.

    Edges are made between cities that are less then 300 miles apart.
    """
    import math
    import re
    import gzip

    G = pgv.AGraph(name="miles_dat")
    G.node_attr["shape"] = "circle"
    G.node_attr["fixedsize"] = "true"
    G.node_attr["fontsize"] = "8"
    G.node_attr["style"] = "filled"
    G.graph_attr["outputorder"] = "edgesfirst"
    G.graph_attr["label"] = "miles_dat"
    G.graph_attr["ratio"] = "1.0"
    G.edge_attr["color"] = "#1100FF"
    G.edge_attr["style"] = "setlinewidth(2)"

    cities = []
    for line in gzip.open("miles_dat.txt.gz", "rt"):
        if line.startswith("*"):  # skip comments
            continue
        numfind = re.compile(r"^\d+")

        if numfind.match(line):  # this line is distances
            dist = line.split()
            for d in dist:
                if float(d) < 300:  # connect if closer then 300 miles
                    G.add_edge(city, cities[i])
                i = i + 1
        else:  # this line is a city, position, population
            i = 1
            (city, coordpop) = line.split("[")
            cities.insert(0, city)
            (coord, pop) = coordpop.split("]")
            (y, x) = coord.split(",")
            G.add_node(city)
            n = G.get_node(city)
            # assign positions, scale to be something reasonable in points
            n.attr["pos"] = "%f,%f)" % (
                -(float(x) - 7000) / 10.0,
                (float(y) - 2000) / 10.0,
            )
            # assign node size, in sqrt of 1,000,000's of people
            d = math.sqrt(float(pop) / 1000000.0)
            n.attr["height"] = "%s" % (d / 2)
            n.attr["width"] = "%s" % (d / 2)
            # assign node color
            n.attr["fillcolor"] = "#0000%2x" % (int(d * 256))
            # empty labels
            n.attr["label"] = " "

    return G


if __name__ == "__main__":
    import warnings
    import pygraphviz as pgv

    # ignore Graphviz warning messages
    warnings.simplefilter("ignore", RuntimeWarning)

    G = miles_graph()
    print("Loaded miles_dat.txt containing 128 cities.")

    G.write("miles.dot")
    print("Wrote miles.dot")
    G.draw("miles.png", prog="neato", args="-n2")
    print("Wrote miles.png")
Total running time of the script: ( 0 minutes 0.135 seconds)