Note
Go to the end to download the full example code.
Basic#
A simple example to create a graphviz dot file and draw a graph.
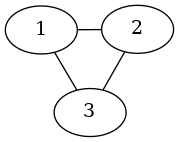
strict graph "" {
        node [label="\N"];
        1 -- 2;
        1 -- 3;
        2 -- 3;
}
#    Copyright (C) 2006 by
#    Aric Hagberg <hagberg@lanl.gov>
#    Dan Schult <dschult@colgate.edu>
#    Manos Renieris, http://www.cs.brown.edu/~er/
#    Distributed with BSD license.
#    All rights reserved, see LICENSE for details.

__author__ = """Aric Hagberg (hagberg@lanl.gov)"""

import pygraphviz as pgv

A = pgv.AGraph()

A.add_edge(1, 2)
A.add_edge(2, 3)
A.add_edge(1, 3)

print(A.string())  # print to screen
A.write("simple.dot")  # write to simple.dot

B = pgv.AGraph("simple.dot")  # create a new graph from file
B.layout()  # layout with default (neato)
B.draw("simple.png")  # draw png