Note
Go to the end to download the full example code.
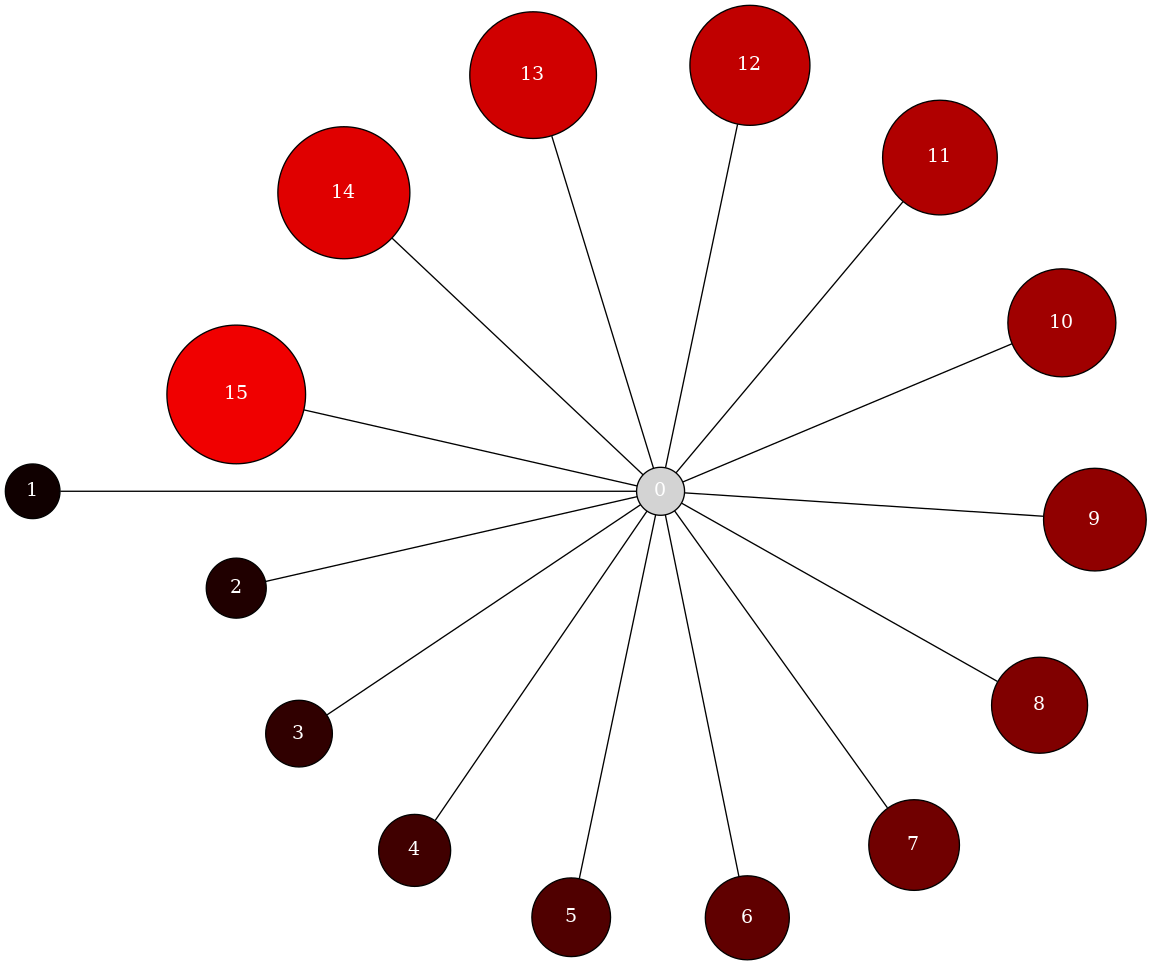
Star#
Create and draw a star with varying node properties.
strict graph "" {
        node [fixedsize=true,
                fontcolor="#FFFFFF",
                label="\N",
                shape=circle,
                style=filled
        ];
        1       [fillcolor="#100000",
                height=0.5625,
                width=0.5625];
        0 -- 1;
        2       [fillcolor="#200000",
                height=0.625,
                width=0.625];
        0 -- 2;
        3       [fillcolor="#300000",
                height=0.6875,
                width=0.6875];
        0 -- 3;
        4       [fillcolor="#400000",
                height=0.75,
                width=0.75];
        0 -- 4;
        5       [fillcolor="#500000",
                height=0.8125,
                width=0.8125];
        0 -- 5;
        6       [fillcolor="#600000",
                height=0.875,
                width=0.875];
        0 -- 6;
        7       [fillcolor="#700000",
                height=0.9375,
                width=0.9375];
        0 -- 7;
        8       [fillcolor="#800000",
                height=1.0,
                width=1.0];
        0 -- 8;
        9       [fillcolor="#900000",
                height=1.0625,
                width=1.0625];
        0 -- 9;
        10      [fillcolor="#a00000",
                height=1.125,
                width=1.125];
        0 -- 10;
        11      [fillcolor="#b00000",
                height=1.1875,
                width=1.1875];
        0 -- 11;
        12      [fillcolor="#c00000",
                height=1.25,
                width=1.25];
        0 -- 12;
        13      [fillcolor="#d00000",
                height=1.3125,
                width=1.3125];
        0 -- 13;
        14      [fillcolor="#e00000",
                height=1.375,
                width=1.375];
        0 -- 14;
        15      [fillcolor="#f00000",
                height=1.4375,
                width=1.4375];
        0 -- 15;
}
#    Copyright (C) 2006 by
#    Aric Hagberg <hagberg@lanl.gov>
#    Dan Schult <dschult@colgate.edu>
#    Manos Renieris, http://www.cs.brown.edu/~er/
#    Distributed with BSD license.
#    All rights reserved, see LICENSE for details.

__author__ = """Aric Hagberg (hagberg@lanl.gov)"""

from pygraphviz import *

A = AGraph()

# set some default node attributes
A.node_attr["style"] = "filled"
A.node_attr["shape"] = "circle"
A.node_attr["fixedsize"] = "true"
A.node_attr["fontcolor"] = "#FFFFFF"

# make a star in shades of red
for i in range(1, 16):
    A.add_edge(0, i)
    n = A.get_node(i)
    n.attr["fillcolor"] = f"#{i * 16:2x}0000"
    n.attr["height"] = f"{i / 16.0 + 0.5}"
    n.attr["width"] = f"{i / 16.0 + 0.5}"

print(A.string())  # print to screen
A.write("star.dot")  # write to simple.dot
A.draw("star.png", prog="circo")  # draw to png using circo layout